This year in 2022, it may be time for your company to start utilizing operational analytics. This term, also referred to as “real-time reporting” or “actionable analytics,” is used to describe business metrics that focus on measuring existing and real-time operations.
Basically, this tool is used to make your data as up to date and accurate as possible. This is accomplished through meticulous organization and advanced automation.
In today’s competitive economy, it is not enough to just have a lot of data. You must also have data that is precise.
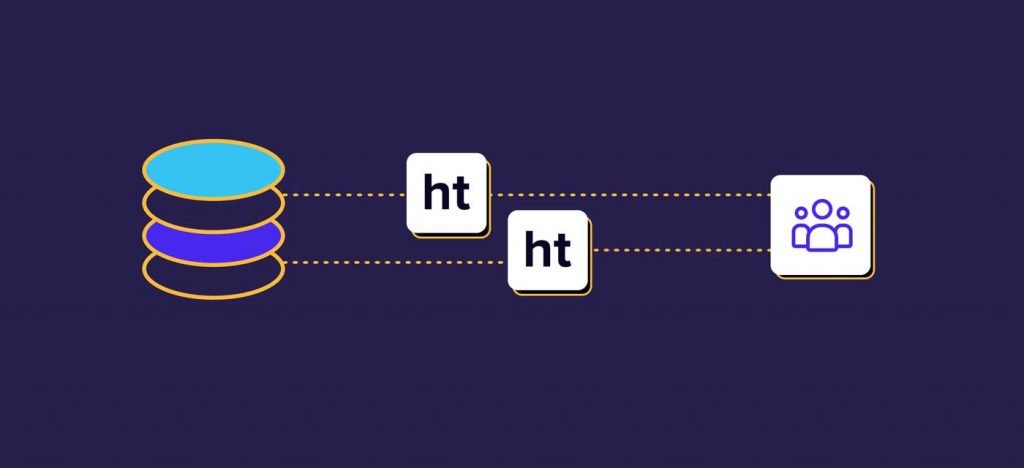
To make your analytics operational, you may want to use reverse ETL to load your data into a third party application like Salesforce or Hubspot. This process, which is a derivative of traditional ETL, or “extract, transform, load,” is becoming increasingly popular among data-intensive companies.
Typically, operational analytics require a robust team of data analysts and engineers, as well as SaaS tools like Tableau and Looker. This can be quite expensive to manage.
However, if you truly believe that your company has the ability to scale, it may be a worthwhile investment. Find out more about this important business tool below!
Operational Analytics In Action
You can’t talk about operational analytics without mentioning statistical analysis. Fact-based management and predictive, explanatory modeling help influence business decisions significantly. Therefore, these two tools are closely tied together.
Statistics can be used to make fully automated decisions or can also just be used as support for management decisions. When your data is made operational, these statistics are organized and made accessible for use.
For instance, if you’re running a restaurant and want to find out which dishes sold best in the past year, a third party application can find that metric for you. You’ll also be able to find other interesting details like how certain dishes performed on a month by month basis.
You may also use operational analytics to diagnose issues within your company and address them promptly. With all of your data available in real time, you can respond to problems immediately, instead of waiting for them to fester.
Operational analytics come with business intelligence. This includes querying, reporting, real time push “alerts”, and online analytical processing (OLAP). These tools can be used to find disparities in metrics, the frequency of certain issues, and what can be done to address them.
Not only can you use these metrics to identify issues, you can use them to fix them. These analytics help you predict the course of your business and stay ahead of the game.
The Rise of Operational Analytics
More and more industries are beginning to incorporate operational analytics into their business. This truly is not a niche asset. It is a tool that can be used by any team in any company.
Banks use operational analytics to differentiate their customers based on usage, credit risk, and other values. Using this data, they can send individual customers the appropriate product offerings.
In the manufacturing industry, operational analytics are used for preventative maintenance. Essentially, this data allows maintenance or the manufacturer to be alerted immediately when their service is needed.
Sales operation analysts benefit from operational analytics greatly. With this tool, they are easily able to collect and evaluate data associated with sales performance. These key insights help guide these analysts’ decisions.
Data scientists also work closely with these databases. They need operational analytics to conduct high-performance coding and computing, machine learning, and parallel processing.
Lastly, this should come as no surprise, but these analytics are often used by operations research analysts. These specialists use complex processes like data mining, optimization, mathematical modeling and statistical analysis to make recommendations for businesses and organizations.
The Various Use Cases
There are many different use cases for operational analytics. However, most of these use cases can be categorized into a few groups: visualization of the environment, troubleshooting of problems, and analysis of decisions.
- Visualizing the application environment allows you to find the best areas of your business to put your resources into. Recognizing how your data responds to certain catalysts can help you get the most out of your time and money.
- Troubleshooting is important for any company. Customers want to know that the brand they’re shopping from will solve any potential issues they run into. Being able to use generated data to quickly identify the root cause of an issue will allow you to prevent any potential disasters from breaking out.
- Analyzing your decisions as a business allows you to reflect on past choices and see exactly how they impacted your company. Operational analytics will bring these things to light.

